
Simulating satellite imagery to verify NWP models for forecasting
Forecasters are experts at using and interpreting satellite imagery. Having a way of directly comparing cloud and moisture from the model with observations is a valuable tool for verifying the NWP model in near real time. Simulated satellite images allow this direct comparison to take place.
The sophisticated NWP SAF fast radiative transfer model, RTTOV, provides the means to simulate the top-of-atmosphere radiances over the spectral response of particular satellite instrument channels, and calculate the corresponding brightness temperatures or reflectances. The NWP model provides surface parameters and profiles of pressure, temperature, humidity and cloud properties from every NWP model grid-point. Using this NWP input, RTTOV models the interaction of radiation with particles in the atmosphere by solving the Radiative Transfer equation including emission, absorption and scattering processes.
The resulting simulated top-of-atmosphere brightness temperature or reflectance can then be plotted with colour scales, image area and map projections defined to match those of the observed satellite imagery which forecasters are accustomed to using. The observed and simulated satellite images are compared by eye by the forecasters.
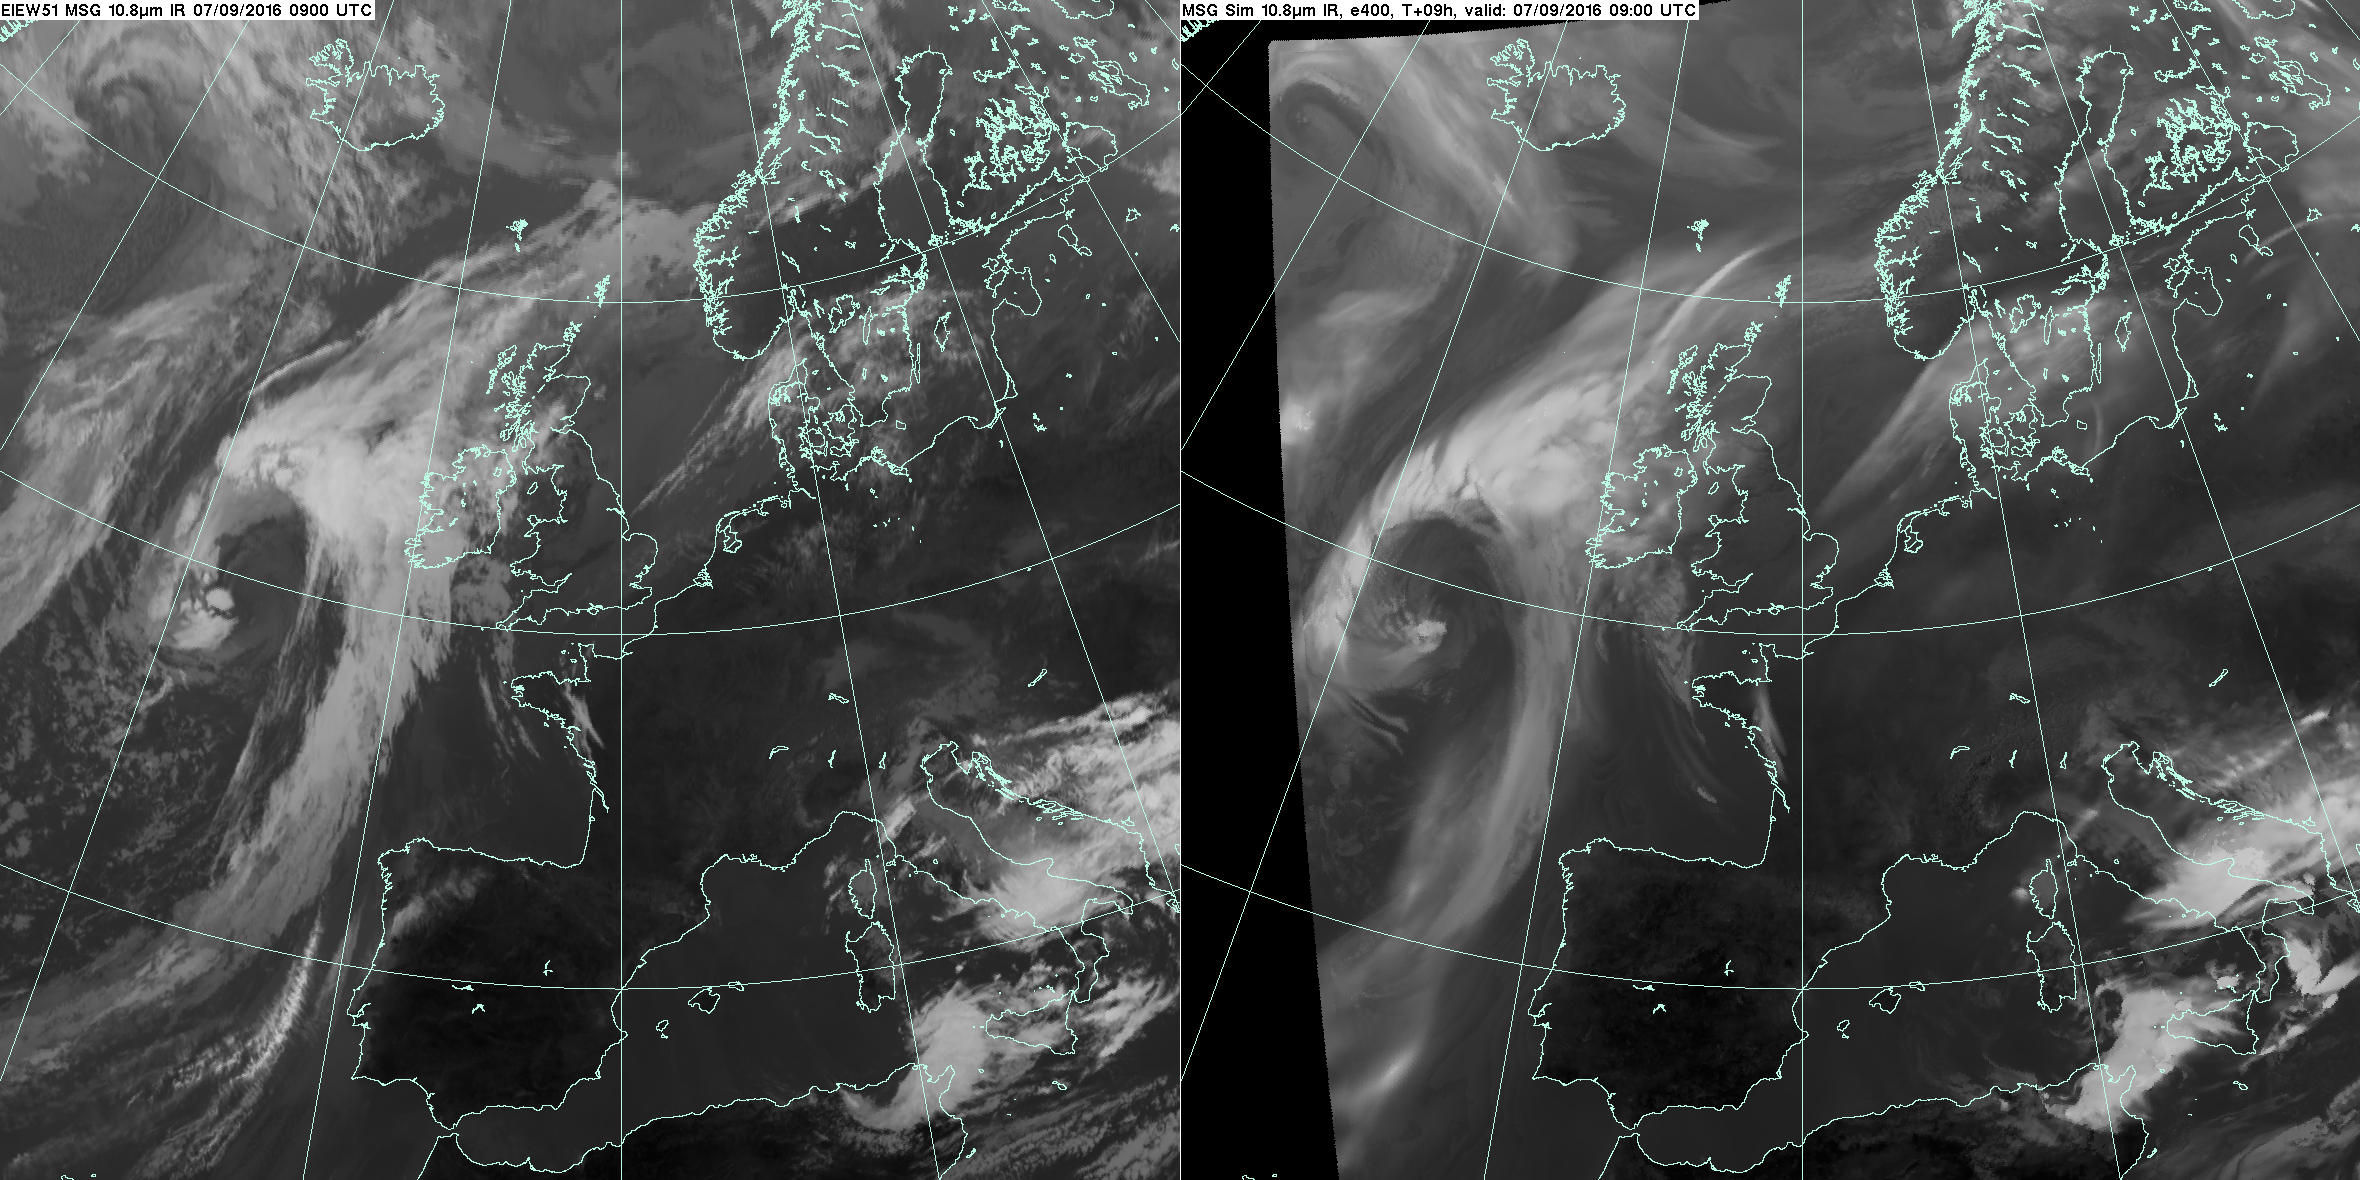
Observed (L) and simulated (R) SEVIRI 10.8um (IR window channel). The simulated image comes from a 9 hour forecast from a Met Office 4.4km NWP model over Europe.
Using this comparison the forecaster is able to identify any significant difference between the early stages of a model forecast and observed cloud or water vapour, and account for any major differences in the subsequent guidance issued to the public or customers.
Simulated and observed water vapour imagery comparisons are frequently used to look at differences in position or intensity of large scale dynamical features higher in the atmosphere, such as troughs and features associated with fronts, allowing forecasters to identify cases where the model evolution is ahead of or behind the observations. Simulated IR window channel brightness temperatures and visible channel reflectances can be very useful for verifying model cloud amounts and other cloud parameters, as well as the larger scale dynamics.
In addition to benefiting forecasters there are further applications of simulated satellite imagery, for example as a NWP model development verification tool by researchers and modellers.
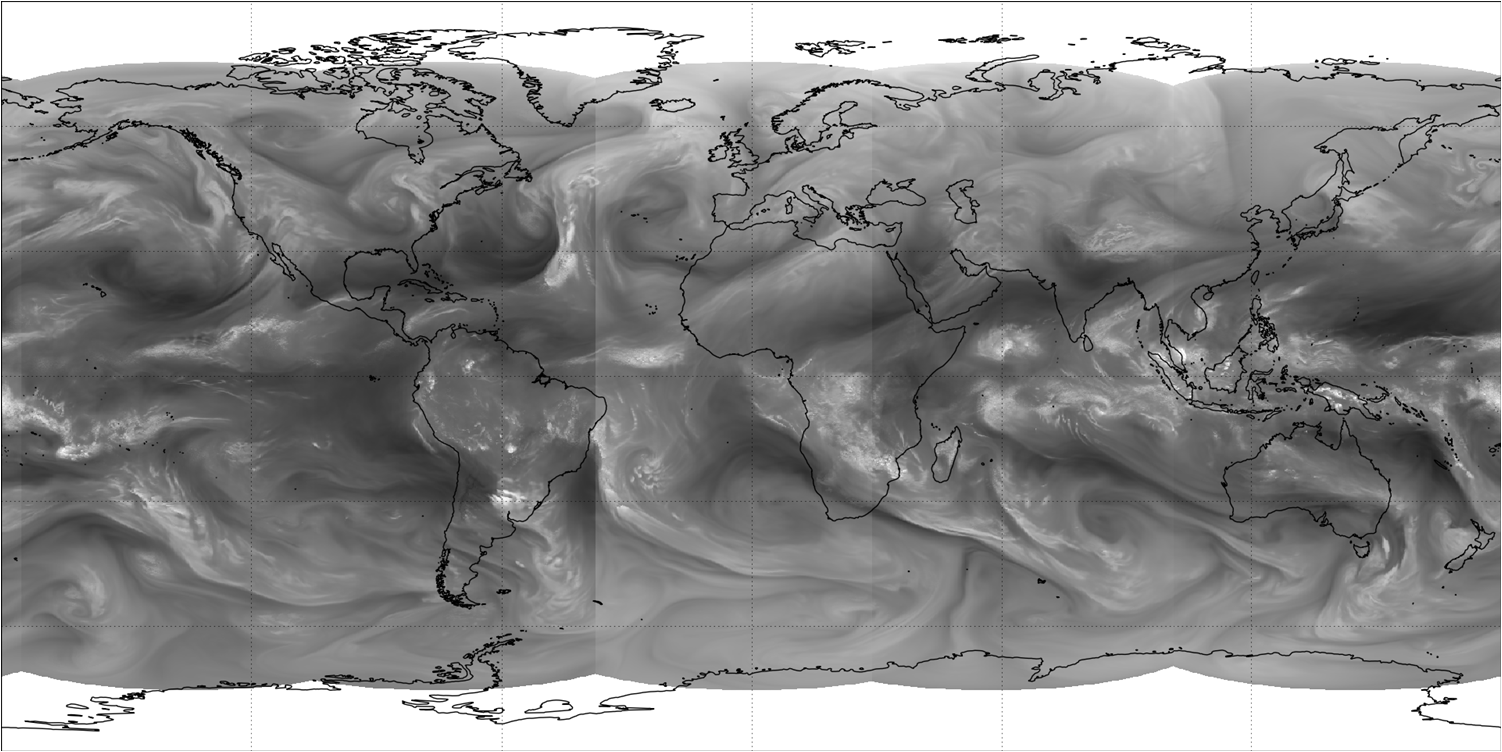
Composite of 5 simulated geostationary satellite images. Upper troposheric water vapour channels. Each instrument’s channel has a slightly different central wavelength and bandwidth.